Cleaning Summary: Covered Interest Parity (CIP) Arbitrage Spreads#
Source: Du, W., & Schreger, J. (2023). Covered Interest Parity Deviations: Macro Risks and Market Frictions. Harvard Business School. Link to paper
Data Collection and Processing Pipeline#
This analysis examines Covered Interest Parity (CIP) deviations using a two-stage data processing pipeline:
Data Retrieval (
pull_bbg_foreign_exchange.py): Fetches raw foreign exchange data from Bloomberg Terminal, including spot exchange rates, 3-month forward points, and Overnight Index Swap (OIS) rates for eight G10 currencies versus USD.CIP Calculation (
calc_cip.py): Processes the raw data to compute CIP arbitrage spreads, applying standardized transformations and outlier detection methods.
import sys
from pathlib import Path

sys.path.insert(0, "../../src")
sys.path.insert(0, "./src")

import calc_cip
import cip_analysis
import pandas as pd

from settings import config

DATA_DIR = Path(config("DATA_DIR")) / "cip"
Data Sources and Coverage#
Our analysis examines Covered Interest Parity (CIP) deviations across eight G10 currencies against the USD, using data from 1999 onwards sourced through Bloomberg Terminal. The dataset includes:
Spot exchange rates: Current market rates for currency pairs
3-month forward points: Market-quoted forward premiums/discounts
Overnight Index Swap (OIS) rates: Risk-free benchmark rates for each currency
Currency Coverage: AUD, CAD, CHF, EUR, GBP, JPY, NZD, and SEK versus USD
Data Standardization: The analysis accounts for different market quotation conventions:
Forward points are scaled appropriately (per 10,000 for most currencies, per 100 for JPY)
Currencies conventionally quoted as USD-per-foreign-currency (EUR, GBP, AUD, NZD) are converted to reciprocal rates for consistency
OIS rates serve as our risk-free benchmark to align with other arbitrage spread studies
spot_rates = pd.read_parquet(DATA_DIR / "fx_spot_rates.parquet")
fwd_pts = pd.read_parquet(DATA_DIR / "fx_forward_points.parquet")
int_rates = pd.read_parquet(DATA_DIR / "fx_interest_rates.parquet")
cip_table = calc_cip.calculate_cip(data_dir=DATA_DIR)
cip_table.tail()
| AUD | CAD | CHF | EUR | GBP | JPY | NZD | SEK | |
|---|---|---|---|---|---|---|---|---|
| index | ||||||||
| 2025-02-24 | 0.292534 | 14.172087 | 8.982214 | NaN | 1.935113 | 22.847121 | 2.971642 | 8.420659 |
| 2025-02-25 | 0.172848 | 13.621653 | 4.624919 | NaN | 1.813109 | 20.249373 | 4.234551 | 6.477765 |
| 2025-02-26 | 1.577240 | 12.271818 | 14.994926 | NaN | 2.266906 | 28.436180 | 5.401439 | 12.681800 |
| 2025-02-27 | 1.664576 | 15.707525 | 19.578262 | NaN | 3.282794 | 32.314552 | 2.293667 | 15.033099 |
| 2025-02-28 | 1.434554 | 17.483297 | 19.764014 | NaN | 3.331081 | 33.042709 | 2.293880 | 14.332039 |
Data Processing Steps#
The raw Bloomberg data undergoes several standardization steps in pull_bbg_foreign_exchange.py:
Forward Rate Calculation: Forward points are converted to actual forward rates by:
Scaling forward points (÷10,000 for most currencies, ÷100 for JPY)
Adding scaled points to corresponding spot rates
Currency Convention Standardization: To ensure consistent USD-per-foreign-currency quotation:
EUR, GBP, AUD, and NZD rates are converted to reciprocals (1.0 / original rate)
Applied to both spot and forward rates for these currencies
Data Merging: Spot rates, forward rates, and OIS rates are merged on date indices for comprehensive analysis
CIP Spread Calculation#
Using the prepared data, we calculate CIP arbitrage spreads using the log-linearized formula.
print(f"Max CIP Deviation: {cip_table.max().idxmax()}")
Max CIP Deviation: JPY
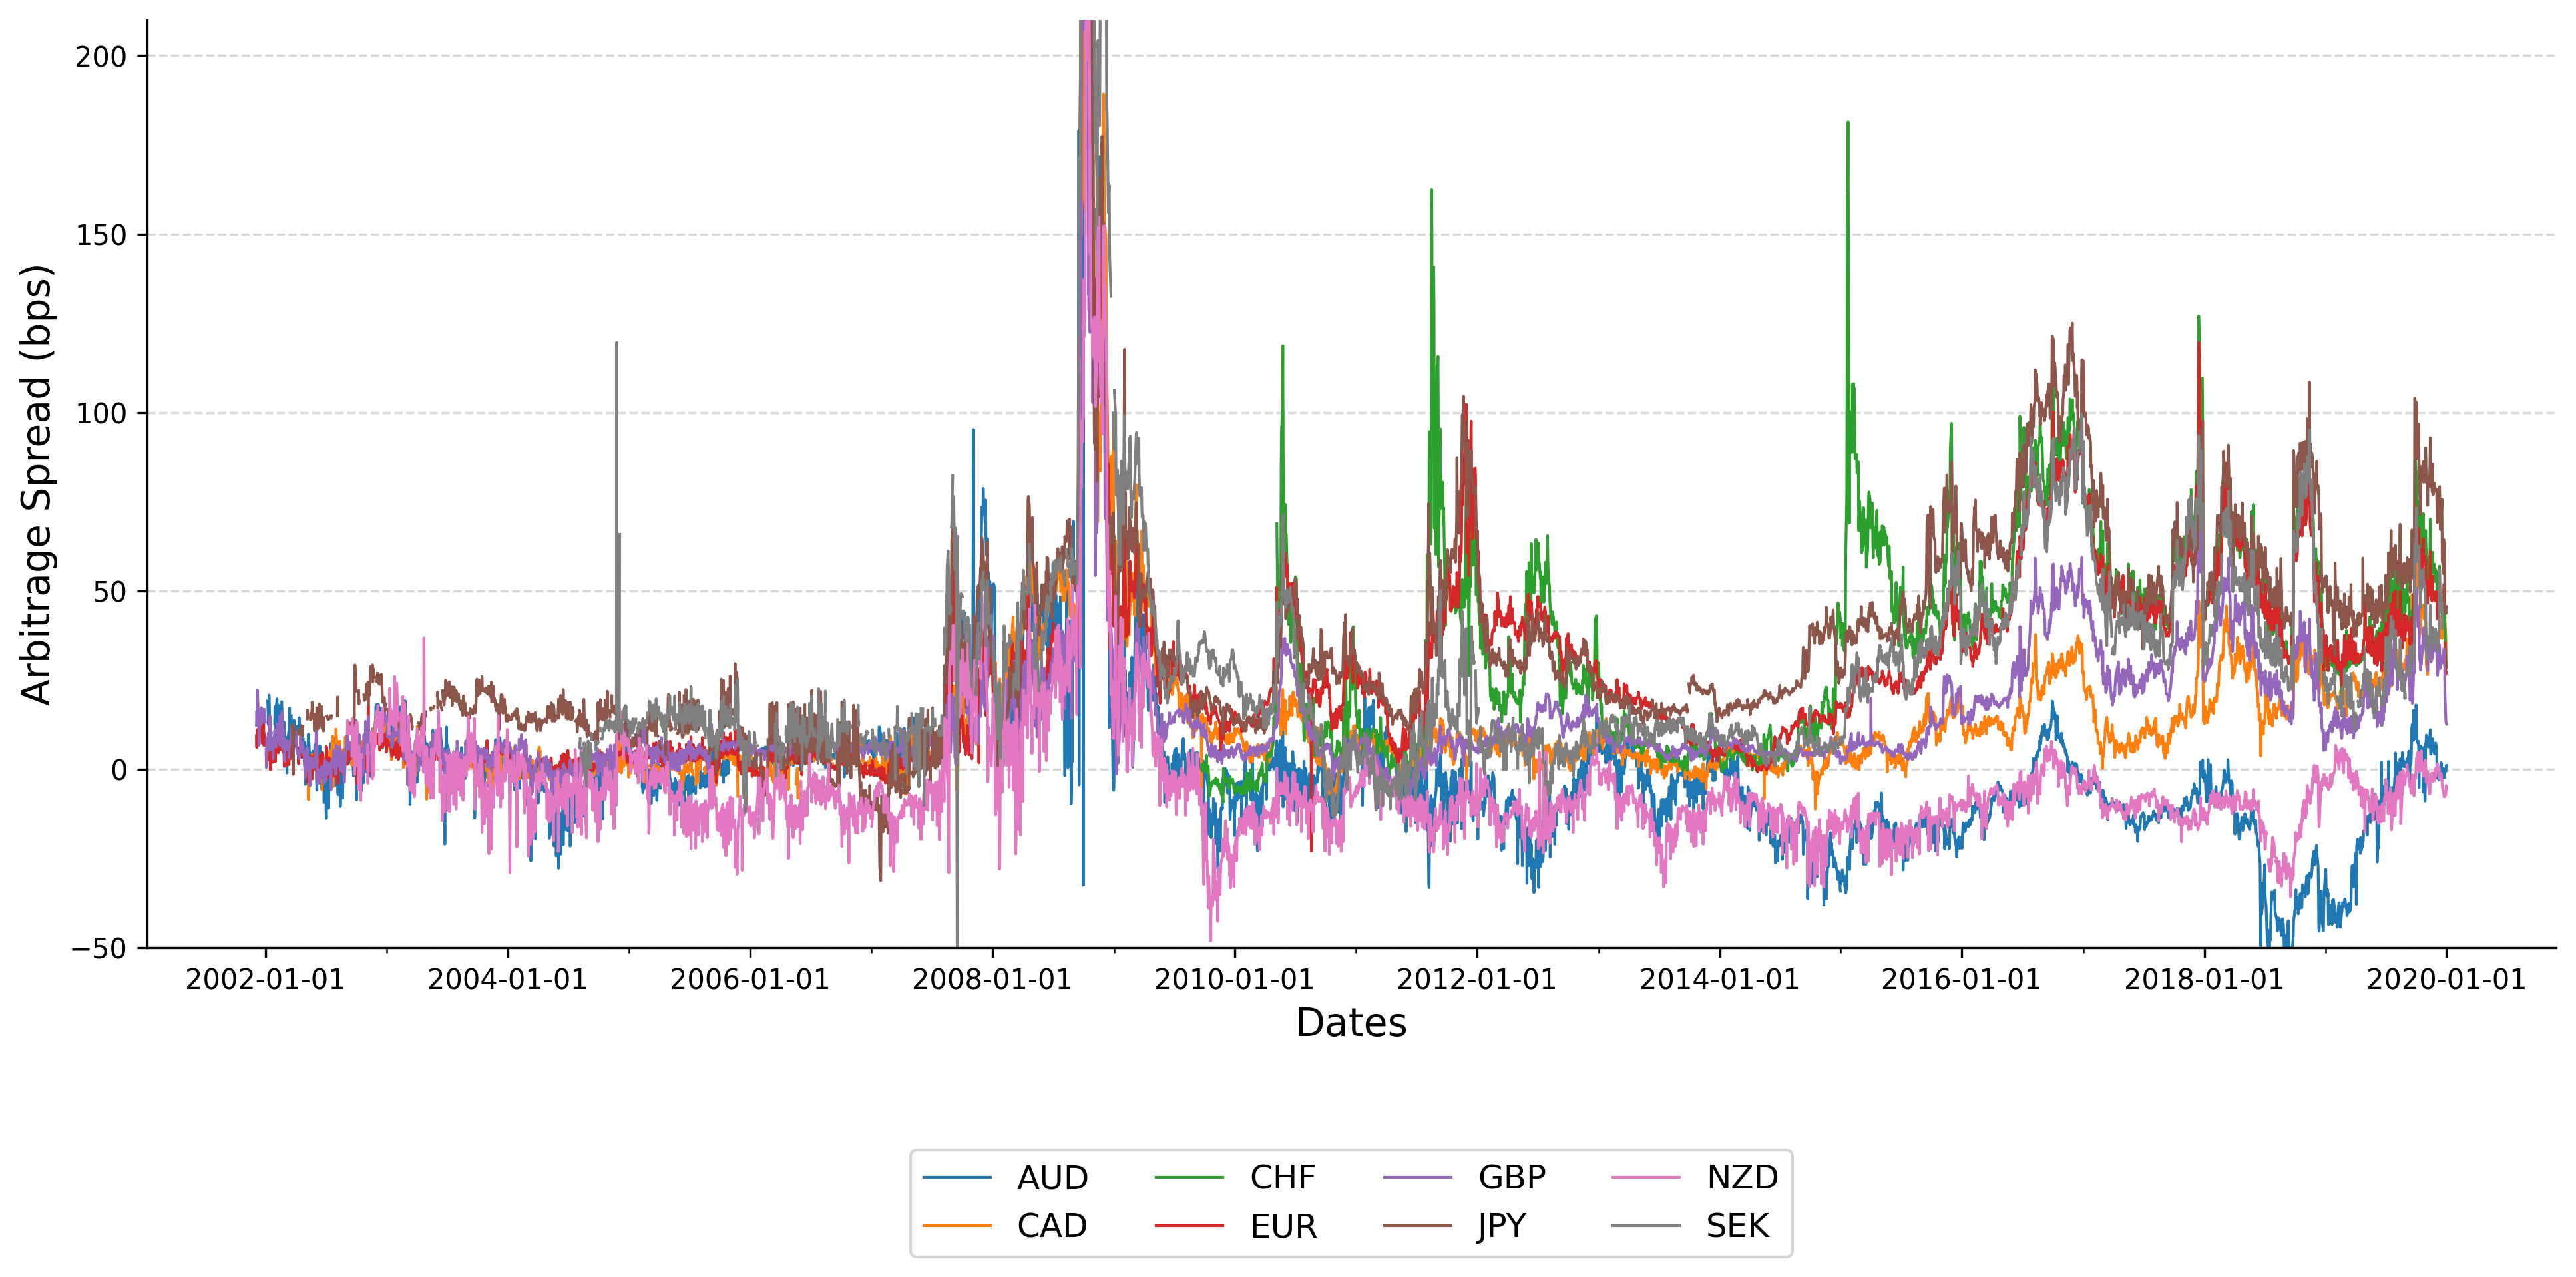
cip_table_replicate = calc_cip.calculate_cip(end_date="2020-01-01", data_dir=DATA_DIR)
cip_table_replicate.tail()
| AUD | CAD | CHF | EUR | GBP | JPY | NZD | SEK | |
|---|---|---|---|---|---|---|---|---|
| index | ||||||||
| 2019-12-26 | -2.266847 | 45.379212 | 49.482634 | NaN | 33.275712 | 63.450330 | -7.651565 | NaN |
| 2019-12-27 | -0.501872 | 42.747994 | 41.093553 | 35.335797 | 21.219397 | 44.886575 | -7.084184 | NaN |
| 2019-12-30 | -0.608663 | 36.439406 | 28.240115 | 26.613417 | 13.562790 | 43.658422 | -7.111196 | NaN |
| 2019-12-31 | 1.051805 | 29.428635 | 29.884460 | 27.209910 | 12.931200 | 45.631356 | -4.563916 | NaN |
| 2020-01-01 | 1.057455 | 29.441495 | 29.016847 | NaN | 12.657879 | 45.605954 | -5.469134 | NaN |
print(f"Max CIP Deviation: {cip_table_replicate.max().idxmax()}")
Max CIP Deviation: JPY
calc_cip.plot_cip_from_data(
    cip_table_replicate, end_date="2020-01-01", output_suffix="replicate"
)
CIP Calculation and Data Cleaning Process#
The CIP spread calculation in calc_cip.py follows these steps:
CIP Formula Application:
Uses log-linearized CIP formula: CIP = 10,000 × [domestic_rate - (ln(F) - ln(S)) × (360/90) - foreign_rate]
Domestic rate: Currency-specific OIS rate
Foreign rate: USD OIS rate
Forward premium: Annualized using 360/90 day convention
Outlier Detection and Cleaning:
Implements 45-day rolling window outlier detection
Calculates rolling median and mean absolute deviation (MAD)
Removes extreme values exceeding 10× rolling MAD threshold
Replaces outliers with NaN to preserve time series structure
Output Formatting: Final spreads are expressed in basis points with shortened currency labels for analysis
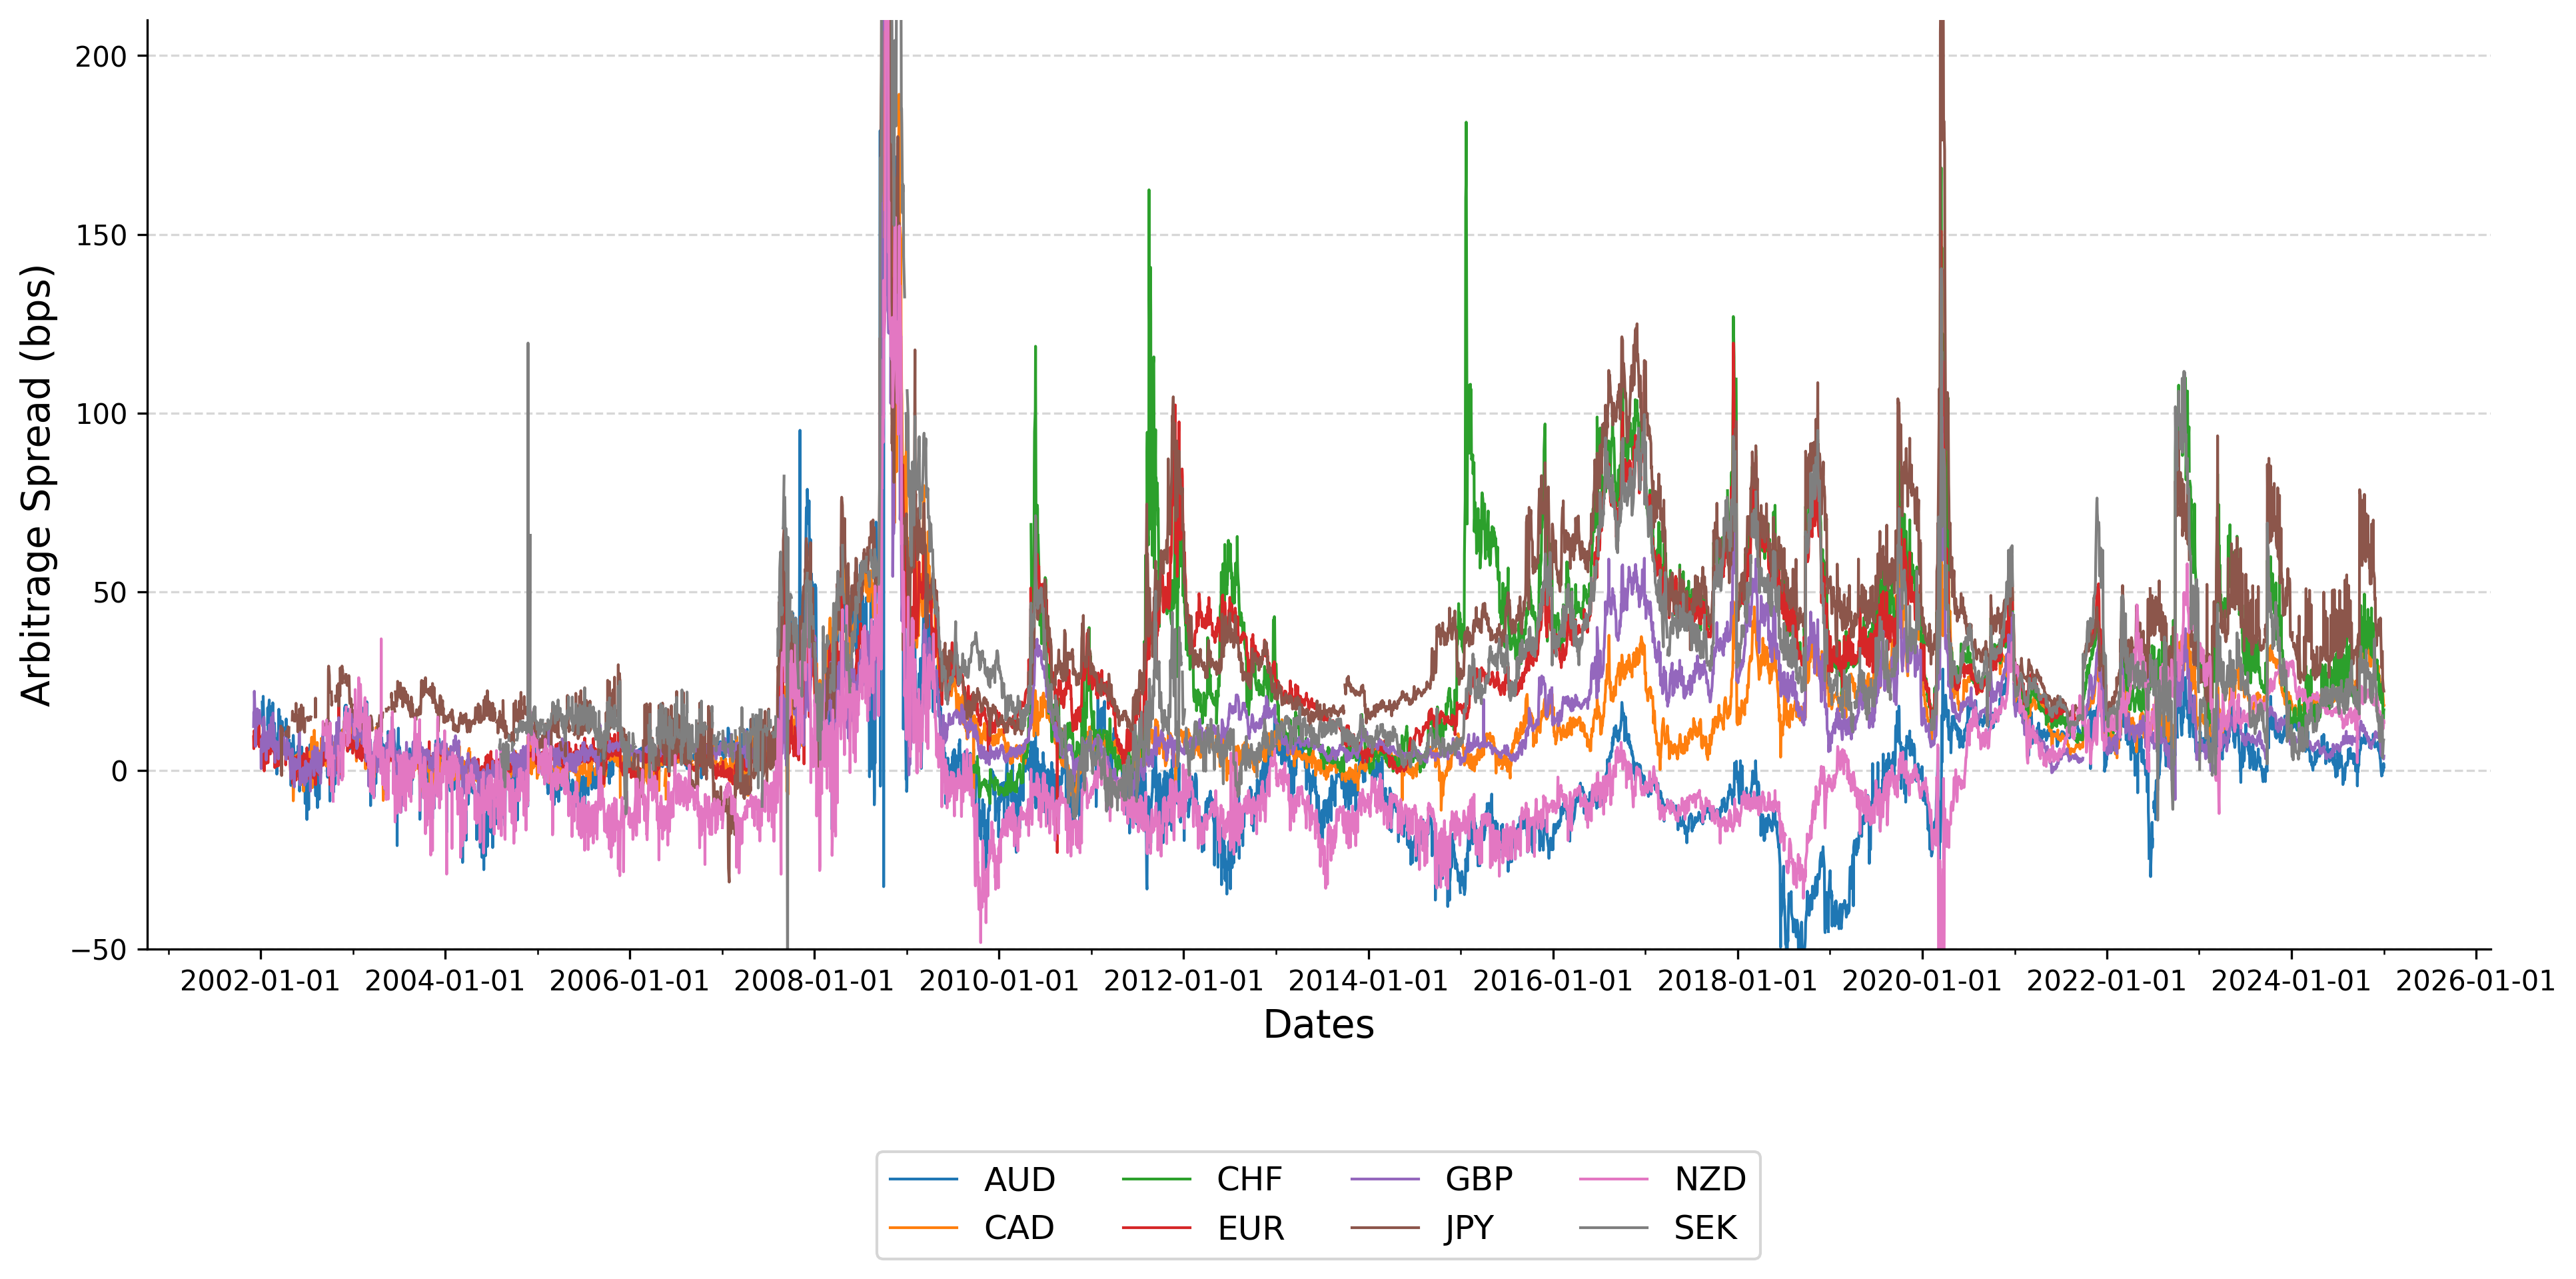
Extended Analysis: 2025 Dataset#
We extend our analysis to include more recent data through 2025 to examine contemporary CIP patterns.
cip_table_2025 = calc_cip.calculate_cip(end_date="2025-01-01", data_dir=DATA_DIR)
cip_table_2025.tail()
| AUD | CAD | CHF | EUR | GBP | JPY | NZD | SEK | |
|---|---|---|---|---|---|---|---|---|
| index | ||||||||
| 2024-12-26 | -0.766333 | 23.128393 | 24.550246 | NaN | 5.442398 | 33.221177 | 11.513906 | 15.338563 |
| 2024-12-27 | -0.479475 | 22.250737 | 19.704683 | NaN | 4.505007 | 25.733427 | 12.095516 | 3.560293 |
| 2024-12-30 | 0.007007 | 19.622446 | 12.229501 | NaN | 3.395406 | 22.690483 | 11.731758 | 8.169759 |
| 2024-12-31 | 1.955078 | 17.960460 | 16.511929 | NaN | 3.207715 | 22.661975 | 14.076388 | 8.532510 |
| 2025-01-01 | 0.911087 | 18.164521 | 16.966331 | NaN | 4.023649 | 22.194161 | 13.433583 | NaN |
calc_cip.plot_cip_from_data(cip_table_2025, end_date="2025-01-01", output_suffix="2025")
Summary Statistics and Cross-Currency Analysis#
The following section provides comprehensive statistical analysis of CIP deviations across currencies and time periods.
cip_table_2025.describe()
| AUD | CAD | CHF | EUR | GBP | JPY | NZD | SEK | |
|---|---|---|---|---|---|---|---|---|
| count | 5970.000000 | 5660.000000 | 3955.000000 | 5216.000000 | 5988.000000 | 5720.000000 | 5761.000000 | 4927.000000 |
| mean | 1.902974 | 15.416702 | 34.407832 | 26.246745 | 14.440782 | 37.639820 | 0.036919 | 29.500217 |
| std | 24.277389 | 20.871205 | 25.960965 | 28.142437 | 19.107388 | 31.686964 | 21.042555 | 32.372212 |
| min | -58.535205 | -11.137506 | -9.265949 | -22.949140 | -11.714736 | -31.232456 | -65.252431 | -75.020107 |
| 25% | -9.055422 | 3.909675 | 14.099077 | 4.896297 | 5.384825 | 17.565810 | -11.572965 | 11.210014 |
| 50% | 1.197543 | 10.259452 | 30.458430 | 21.257006 | 8.617490 | 32.102677 | -5.542426 | 22.094620 |
| 75% | 8.380603 | 21.575389 | 48.928764 | 38.609088 | 18.266183 | 49.271931 | 9.521876 | 37.419639 |
| max | 339.688767 | 313.189228 | 181.363535 | 370.943999 | 287.634939 | 439.593674 | 257.471179 | 374.543530 |
# Create a version with the column names that cip_analysis expects
cip_table_2025_for_analysis = cip_table_2025.copy()
cip_table_2025_for_analysis.columns = [
    f"CIP_{col}_ln" for col in cip_table_2025_for_analysis.columns
]
stats = cip_analysis.compute_cip_statistics(cip_table_2025_for_analysis)
cip_analysis.display_cip_summary(stats)
================================================================================
OVERALL CIP STATISTICS (in basis points)
================================================================================
       CIP_AUD_ln  CIP_CAD_ln  CIP_CHF_ln  CIP_EUR_ln  CIP_GBP_ln  CIP_JPY_ln  \
count     5970.00     5660.00     3955.00     5216.00     5988.00     5720.00
mean         1.90       15.42       34.41       26.25       14.44       37.64
std         24.28       20.87       25.96       28.14       19.11       31.69
min        -58.54      -11.14       -9.27      -22.95      -11.71      -31.23
25%         -9.06        3.91       14.10        4.90        5.38       17.57
50%          1.20       10.26       30.46       21.26        8.62       32.10
75%          8.38       21.58       48.93       38.61       18.27       49.27
max        339.69      313.19      181.36      370.94      287.63      439.59

       CIP_NZD_ln  CIP_SEK_ln
count     5761.00     4927.00
mean         0.04       29.50
std         21.04       32.37
min        -65.25      -75.02
25%        -11.57       11.21
50%         -5.54       22.09
75%          9.52       37.42
max        257.47      374.54
cip_analysis.display_cip_corr(stats)
================================================================================
CORRELATION MATRIX
================================================================================
            CIP_AUD_ln  CIP_CAD_ln  CIP_CHF_ln  CIP_EUR_ln  CIP_GBP_ln  \
CIP_AUD_ln       1.000       0.714      -0.085       0.393       0.600
CIP_CAD_ln       0.714       1.000       0.505       0.760       0.830
CIP_CHF_ln      -0.085       0.505       1.000       0.839       0.730
CIP_EUR_ln       0.393       0.760       0.839       1.000       0.893
CIP_GBP_ln       0.600       0.830       0.730       0.893       1.000
CIP_JPY_ln       0.405       0.767       0.827       0.939       0.849
CIP_NZD_ln       0.806       0.716      -0.003       0.446       0.529
CIP_SEK_ln       0.622       0.851       0.766       0.847       0.894

            CIP_JPY_ln  CIP_NZD_ln  CIP_SEK_ln
CIP_AUD_ln       0.405       0.806       0.622
CIP_CAD_ln       0.767       0.716       0.851
CIP_CHF_ln       0.827      -0.003       0.766
CIP_EUR_ln       0.939       0.446       0.847
CIP_GBP_ln       0.849       0.529       0.894
CIP_JPY_ln       1.000       0.430       0.828
CIP_NZD_ln       0.430       1.000       0.598
CIP_SEK_ln       0.828       0.598       1.000
cip_analysis.display_cip_max_min(stats)
================================================================================
EXTREME CIP DEVIATIONS
================================================================================
Most Positive CIP Deviation: CIP_JPY_ln (37.64 bps)
Most Negative CIP Deviation: CIP_NZD_ln (0.04 bps)