PCA Index Interactive Visualization Examples#
import plotly.express as px
from settings import config
import pull_fred
import pca_index
DATA_DIR = config("DATA_DIR")
df = pull_fred.load_fred(data_dir=DATA_DIR)
dfn = pca_index.transform_series(df)
/home/runner/work/example-updating-dashboard/example-updating-dashboard/src/pca_index.py:29: FutureWarning: The default fill_method='pad' in Series.pct_change is deprecated and will be removed in a future version. Either fill in any non-leading NA values prior to calling pct_change or specify 'fill_method=None' to not fill NA values.
df["NASDAQ"].pct_change().rolling(90, min_periods=1).mean()
/home/runner/work/example-updating-dashboard/example-updating-dashboard/src/pca_index.py:30: FutureWarning: The default fill_method='pad' in Series.pct_change is deprecated and will be removed in a future version. Either fill in any non-leading NA values prior to calling pct_change or specify 'fill_method=None' to not fill NA values.
- df["NASDAQ"].pct_change().mean()
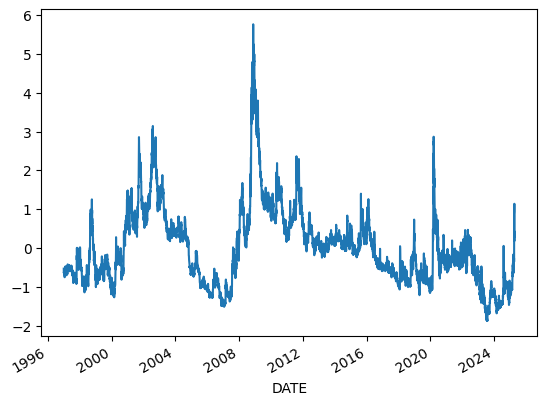
## Visualize Principal Component 1
pc1, loadings = pca_index.pca(dfn, module="scikitlearn")
pc1.plot();
# Simple version
fig = px.line(pc1)
fig.show()
# Using slider and quick views
fig = pca_index.pc1_line_plot(pc1)
fig.show()
## Visualize normalized and raw series
dfn.plot(subplots=True, figsize=(10, 10));
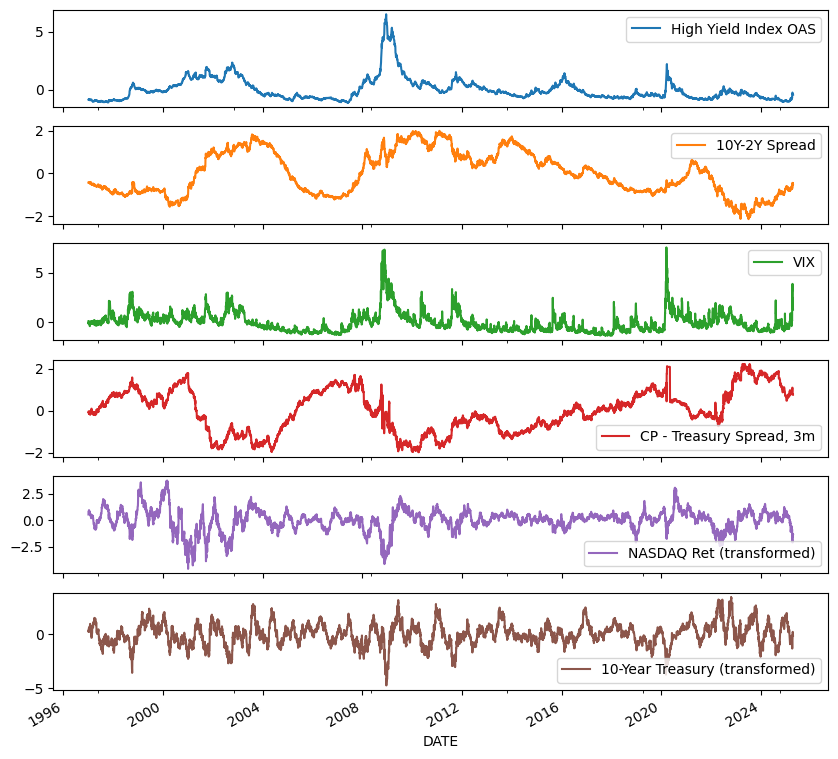
fig = px.line(dfn, facet_col="variable", facet_col_wrap=1)
fig.update_yaxes(matches=None)
fig.show()
fig = pca_index.plot_unnormalized_series(df)
fig.show()
fig = pca_index.plot_normalized_series(dfn)
fig.show()