PCA Index Interactive Visualization Examples#
import plotly.express as px
from settings import config
import pull_fred
import pca_index
DATA_DIR = config("DATA_DIR")
/home/runner/work/example-updating-dashboard/example-updating-dashboard/.venv/lib/python3.10/site-packages/requests/__init__.py:113: RequestsDependencyWarning: urllib3 (2.6.3) or chardet (6.0.0.post1)/charset_normalizer (3.4.4) doesn't match a supported version!
warnings.warn(
df = pull_fred.load_fred(data_dir=DATA_DIR)
dfn = pca_index.transform_series(df)
/home/runner/work/example-updating-dashboard/example-updating-dashboard/src/pca_index.py:29: FutureWarning: The default fill_method='pad' in Series.pct_change is deprecated and will be removed in a future version. Either fill in any non-leading NA values prior to calling pct_change or specify 'fill_method=None' to not fill NA values.
df["NASDAQ"].pct_change().rolling(90, min_periods=1).mean()
/home/runner/work/example-updating-dashboard/example-updating-dashboard/src/pca_index.py:30: FutureWarning: The default fill_method='pad' in Series.pct_change is deprecated and will be removed in a future version. Either fill in any non-leading NA values prior to calling pct_change or specify 'fill_method=None' to not fill NA values.
- df["NASDAQ"].pct_change().mean()
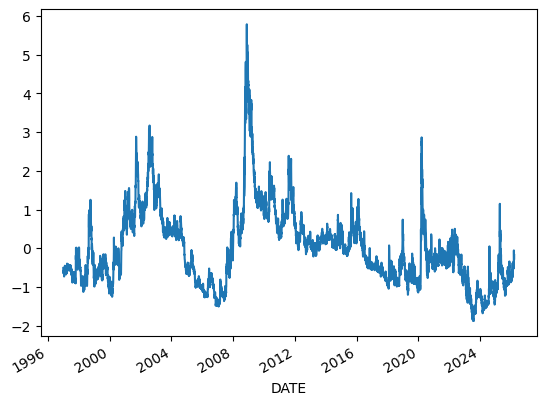
## Visualize Principal Component 1
pc1, loadings = pca_index.pca(dfn, module="scikitlearn")
pc1.plot();
# Simple version
fig = px.line(pc1)
fig.show()
/home/runner/work/example-updating-dashboard/example-updating-dashboard/.venv/lib/python3.10/site-packages/kaleido/_sync_server.py:11: UserWarning:
Warning: You have Plotly version 5.24.1, which is not compatible with this version of Kaleido (1.2.0).
This means that static image generation (e.g. `fig.write_image()`) will not work.
Please upgrade Plotly to version 6.1.1 or greater, or downgrade Kaleido to version 0.2.1.
# Using slider and quick views
fig = pca_index.pc1_line_plot(pc1)
fig.show()
## Visualize normalized and raw series
dfn.plot(subplots=True, figsize=(10, 10));
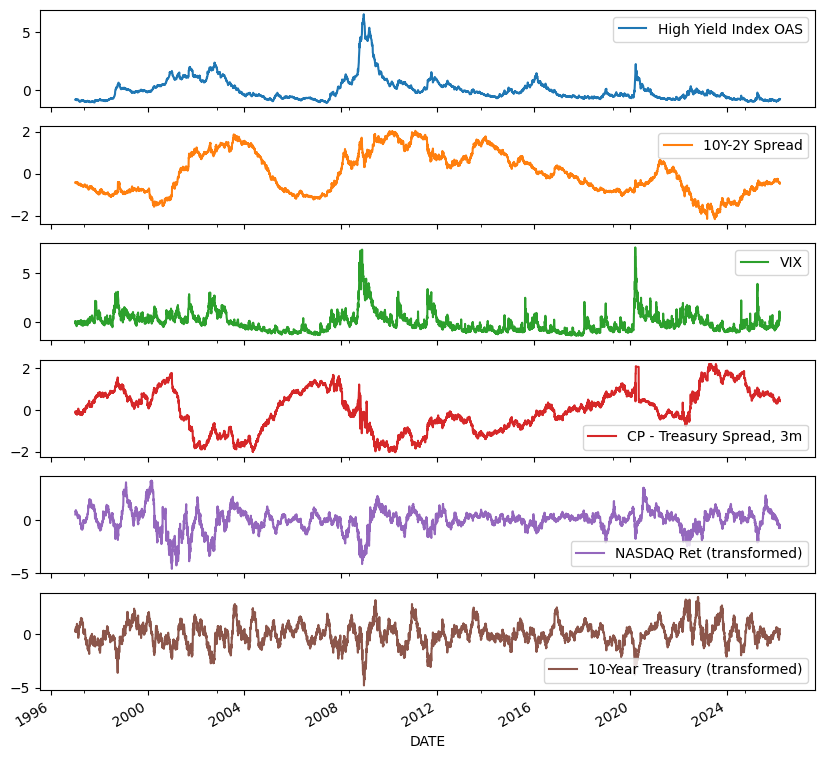
fig = px.line(dfn, facet_col="variable", facet_col_wrap=1)
fig.update_yaxes(matches=None)
fig.show()
fig = pca_index.plot_unnormalized_series(df)
fig.show()
fig = pca_index.plot_normalized_series(dfn)
fig.show()