Explore Basis Trade Data#
import pandas as pd
import polars as pl

from matplotlib import pyplot as plt
import seaborn as sns
sns.set()

from settings import config
import load_bases_data

DATA_DIR = config("DATA_DIR")
MANUAL_DATA_DIR = config("MANUAL_DATA_DIR")
Arbitrage Spreads#
df = load_bases_data.load_combined_spreads_wide(data_dir=MANUAL_DATA_DIR)
# df = df.ffill(limit=5).dropna()
# df.info()
df.info()
<class 'pandas.core.frame.DataFrame'>
DatetimeIndex: 5563 entries, 2001-12-04 to 2024-02-28
Data columns (total 32 columns):
 #   Column             Non-Null Count  Dtype
---  ------             --------------  -----
 0   Box_06m            4435 non-null   float32
 1   Box_12m            4423 non-null   float32
 2   Box_18m            4435 non-null   float32
 3   CDS_Bond_HY        4280 non-null   float32
 4   CDS_Bond_IG        4437 non-null   float32
 5   CIP_AUD            5563 non-null   float32
 6   CIP_CAD            5456 non-null   float32
 7   CIP_CHF            5562 non-null   float32
 8   CIP_EUR            5562 non-null   float32
 9   CIP_GBP            5561 non-null   float32
 10  CIP_JPY            5493 non-null   float32
 11  CIP_NZD            5374 non-null   float32
 12  CIP_SEK            4894 non-null   float32
 13  Eq_SF_Dow          5106 non-null   float32
 14  Eq_SF_NDAQ         5090 non-null   float32
 15  Eq_SF_SPX          5088 non-null   float32
 16  TIPS_Treasury_02Y  4687 non-null   float32
 17  TIPS_Treasury_05Y  4687 non-null   float32
 18  TIPS_Treasury_10Y  4687 non-null   float32
 19  TIPS_Treasury_20Y  4687 non-null   float32
 20  Treasury_SF_02Y    4211 non-null   float32
 21  Treasury_SF_05Y    4575 non-null   float32
 22  Treasury_SF_10Y    4801 non-null   float32
 23  Treasury_SF_20Y    4836 non-null   float32
 24  Treasury_SF_30Y    2412 non-null   float32
 25  Treasury_Swap_01Y  5563 non-null   float32
 26  Treasury_Swap_02Y  5551 non-null   float32
 27  Treasury_Swap_03Y  5515 non-null   float32
 28  Treasury_Swap_05Y  5515 non-null   float32
 29  Treasury_Swap_10Y  3900 non-null   float32
 30  Treasury_Swap_20Y  3106 non-null   float32
 31  Treasury_Swap_30Y  3106 non-null   float32
dtypes: float32(32)
memory usage: 738.8 KB
df.tail()
| Box_06m | Box_12m | Box_18m | CDS_Bond_HY | CDS_Bond_IG | CIP_AUD | CIP_CAD | CIP_CHF | CIP_EUR | CIP_GBP | ... | Treasury_SF_10Y | Treasury_SF_20Y | Treasury_SF_30Y | Treasury_Swap_01Y | Treasury_Swap_02Y | Treasury_Swap_03Y | Treasury_Swap_05Y | Treasury_Swap_10Y | Treasury_Swap_20Y | Treasury_Swap_30Y | |
|---|---|---|---|---|---|---|---|---|---|---|---|---|---|---|---|---|---|---|---|---|---|
| date | |||||||||||||||||||||
| 2024-02-22 | NaN | NaN | NaN | NaN | NaN | 8.251404 | 17.293579 | 17.858582 | 5.813416 | 8.302063 | ... | -16.325012 | -74.609985 | -211.763977 | 4.56 | -13.77 | -21.139999 | -29.330000 | -41.220001 | -69.800003 | -78.449997 |
| 2024-02-23 | NaN | NaN | NaN | NaN | NaN | 6.583923 | 18.220825 | 12.748291 | 4.431885 | 8.169006 | ... | -15.239990 | -59.401978 | -190.694977 | 6.46 | -13.30 | -20.480000 | -29.780001 | -42.310001 | -71.440002 | -77.029999 |
| 2024-02-26 | NaN | NaN | NaN | NaN | NaN | 5.156189 | 18.380493 | 10.448364 | 2.971252 | 8.405518 | ... | -14.094971 | -65.319977 | -183.165985 | 5.58 | -12.50 | -20.879999 | -28.650000 | -42.099998 | -71.699997 | -77.980003 |
| 2024-02-27 | NaN | NaN | NaN | NaN | NaN | 6.320984 | 17.697937 | 18.856445 | 6.171143 | 8.237305 | ... | -18.984985 | -63.867981 | -194.381989 | 5.60 | -12.95 | -22.200001 | -30.320000 | -43.040001 | -72.839996 | -79.169998 |
| 2024-02-28 | NaN | NaN | NaN | NaN | NaN | 8.978394 | 18.759705 | 27.148132 | 8.660278 | 8.211975 | ... | -12.888000 | -79.199005 | -191.681000 | 4.94 | -12.23 | -21.049999 | -28.900000 | -42.540001 | -71.650002 | -77.550003 |
5 rows × 32 columns
df.reindex(sorted(df.columns), axis=1).filter(regex=("Treasury_SF_*")).info()
<class 'pandas.core.frame.DataFrame'>
DatetimeIndex: 5563 entries, 2001-12-04 to 2024-02-28
Data columns (total 5 columns):
 #   Column           Non-Null Count  Dtype
---  ------           --------------  -----
 0   Treasury_SF_02Y  4211 non-null   float32
 1   Treasury_SF_05Y  4575 non-null   float32
 2   Treasury_SF_10Y  4801 non-null   float32
 3   Treasury_SF_20Y  4836 non-null   float32
 4   Treasury_SF_30Y  2412 non-null   float32
dtypes: float32(5)
memory usage: 152.1 KB
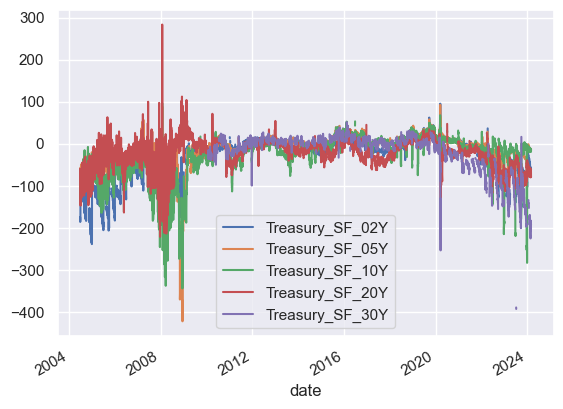
df.reindex(sorted(df.columns), axis=1).filter(regex=("Treasury_SF_*")).plot()
<Axes: xlabel='date'>
(
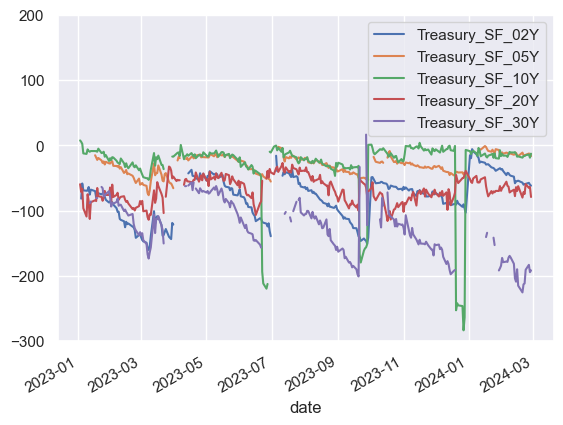
    df
    .loc["2023":,:]
    .reindex(sorted(df.columns), axis=1)
    .filter(regex=("Treasury_SF_*"))
    .plot()
)
plt.ylim([-300,200])
(-300.0, 200.0)
(
    df
    .loc["2024-07":,:]
    .reindex(sorted(df.columns), axis=1)
    .filter(regex=("Treasury_SF_*"))
    .plot()
)
plt.ylim([-300,200])
(-300.0, 200.0)
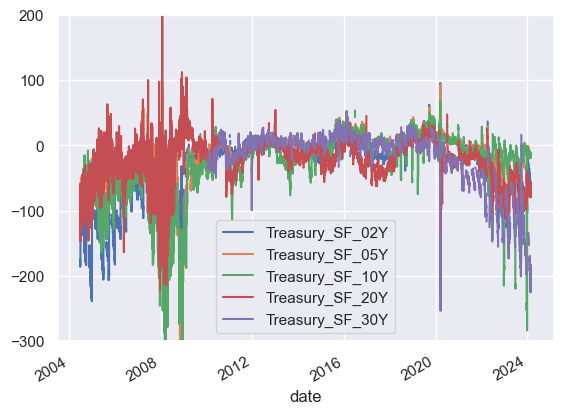
df.reindex(sorted(df.columns), axis=1).filter(regex=("Treasury_SF_*")).plot()
plt.ylim([-300,200])
(-300.0, 200.0)
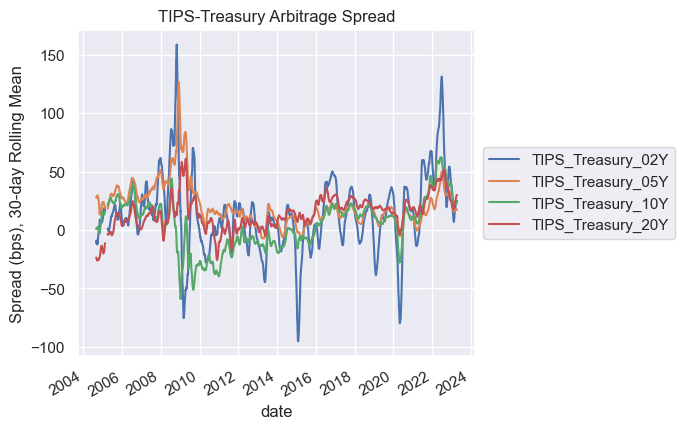
WINDOW = 30
ax= df.reindex(sorted(df.columns), axis=1).filter(regex=("TIPS_*")).rolling(WINDOW).mean().plot()
# plt.ylim([-100,100])
box = ax.get_position()
ax.set_position([box.x0, box.y0, box.width * 0.8, box.height])

# Put a legend to the right of the current axis
ax.legend(loc='center left', bbox_to_anchor=(1, 0.5))

plt.ylabel(f"Spread (bps), {WINDOW}-day Rolling Mean")
plt.title("TIPS-Treasury Arbitrage Spread");
WINDOW = 30
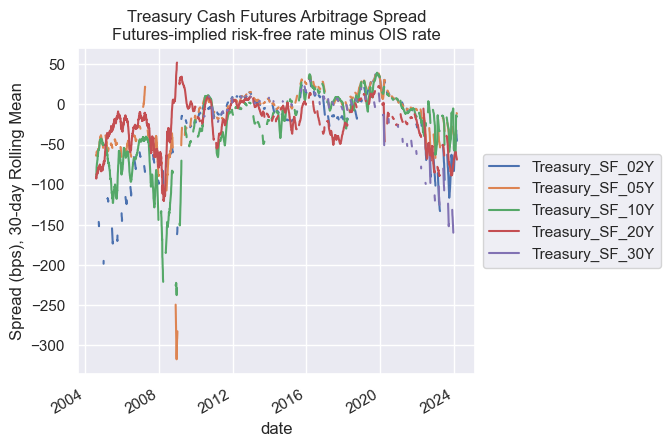
ax= df.reindex(sorted(df.columns), axis=1).filter(regex=("Treasury_SF_*")).rolling(WINDOW).mean().plot()
# plt.ylim([-100,100])
box = ax.get_position()
ax.set_position([box.x0, box.y0, box.width * 0.8, box.height])

# Put a legend to the right of the current axis
ax.legend(loc='center left', bbox_to_anchor=(1, 0.5))

plt.ylabel(f"Spread (bps), {WINDOW}-day Rolling Mean")
plt.title("Treasury Cash Futures Arbitrage Spread\nFutures-implied risk-free rate minus OIS rate");
WINDOW = 30
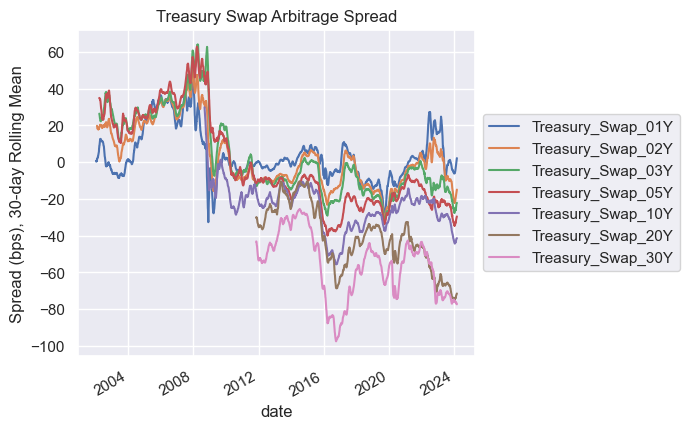
ax= df.reindex(sorted(df.columns), axis=1).filter(regex=("Treasury_Swap_*")).rolling(WINDOW).mean().plot()
# plt.ylim([-100,100])
box = ax.get_position()
ax.set_position([box.x0, box.y0, box.width * 0.8, box.height])

# Put a legend to the right of the current axis
ax.legend(loc='center left', bbox_to_anchor=(1, 0.5))

plt.ylabel(f"Spread (bps), {WINDOW}-day Rolling Mean")
plt.title("Treasury Swap Arbitrage Spread");
WINDOW = 30
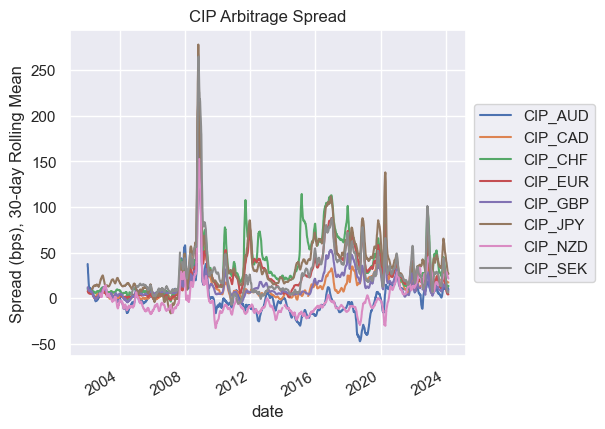
ax= df.reindex(sorted(df.columns), axis=1).filter(regex=("CIP_*")).rolling(WINDOW).mean().plot()
# plt.ylim([-100,100])
box = ax.get_position()
ax.set_position([box.x0, box.y0, box.width * 0.8, box.height])

# Put a legend to the right of the current axis
ax.legend(loc='center left', bbox_to_anchor=(1, 0.5))

plt.ylabel(f"Spread (bps), {WINDOW}-day Rolling Mean")
plt.title("CIP Arbitrage Spread");
df
| Box_06m | Box_12m | Box_18m | CDS_Bond_HY | CDS_Bond_IG | CIP_AUD | CIP_CAD | CIP_CHF | CIP_EUR | CIP_GBP | ... | Treasury_SF_10Y | Treasury_SF_20Y | Treasury_SF_30Y | Treasury_Swap_01Y | Treasury_Swap_02Y | Treasury_Swap_03Y | Treasury_Swap_05Y | Treasury_Swap_10Y | Treasury_Swap_20Y | Treasury_Swap_30Y | |
|---|---|---|---|---|---|---|---|---|---|---|---|---|---|---|---|---|---|---|---|---|---|
| date | |||||||||||||||||||||
| 2001-12-04 | NaN | NaN | NaN | NaN | NaN | 52.145401 | NaN | 13.314026 | 9.184860 | 11.789230 | ... | NaN | NaN | NaN | 7.60 | NaN | NaN | NaN | NaN | NaN | NaN |
| 2001-12-05 | NaN | NaN | NaN | NaN | NaN | 46.005219 | NaN | 12.012970 | 5.848602 | 15.825348 | ... | NaN | NaN | NaN | 8.10 | NaN | NaN | NaN | NaN | NaN | NaN |
| 2001-12-06 | NaN | NaN | NaN | NaN | NaN | 49.061096 | NaN | 16.064270 | 10.815582 | 12.939957 | ... | NaN | NaN | NaN | 4.80 | NaN | NaN | NaN | NaN | NaN | NaN |
| 2001-12-07 | NaN | NaN | NaN | NaN | NaN | 58.456711 | NaN | 15.164368 | 10.896408 | 21.666672 | ... | NaN | NaN | NaN | 5.30 | NaN | NaN | NaN | NaN | NaN | NaN |
| 2001-12-10 | NaN | NaN | NaN | NaN | NaN | 53.464584 | NaN | 12.022736 | 8.434219 | 14.334442 | ... | NaN | NaN | NaN | 2.20 | NaN | NaN | NaN | NaN | NaN | NaN |
| ... | ... | ... | ... | ... | ... | ... | ... | ... | ... | ... | ... | ... | ... | ... | ... | ... | ... | ... | ... | ... | ... |
| 2024-02-22 | NaN | NaN | NaN | NaN | NaN | 8.251404 | 17.293579 | 17.858582 | 5.813416 | 8.302063 | ... | -16.325012 | -74.609985 | -211.763977 | 4.56 | -13.77 | -21.139999 | -29.330000 | -41.220001 | -69.800003 | -78.449997 |
| 2024-02-23 | NaN | NaN | NaN | NaN | NaN | 6.583923 | 18.220825 | 12.748291 | 4.431885 | 8.169006 | ... | -15.239990 | -59.401978 | -190.694977 | 6.46 | -13.30 | -20.480000 | -29.780001 | -42.310001 | -71.440002 | -77.029999 |
| 2024-02-26 | NaN | NaN | NaN | NaN | NaN | 5.156189 | 18.380493 | 10.448364 | 2.971252 | 8.405518 | ... | -14.094971 | -65.319977 | -183.165985 | 5.58 | -12.50 | -20.879999 | -28.650000 | -42.099998 | -71.699997 | -77.980003 |
| 2024-02-27 | NaN | NaN | NaN | NaN | NaN | 6.320984 | 17.697937 | 18.856445 | 6.171143 | 8.237305 | ... | -18.984985 | -63.867981 | -194.381989 | 5.60 | -12.95 | -22.200001 | -30.320000 | -43.040001 | -72.839996 | -79.169998 |
| 2024-02-28 | NaN | NaN | NaN | NaN | NaN | 8.978394 | 18.759705 | 27.148132 | 8.660278 | 8.211975 | ... | -12.888000 | -79.199005 | -191.681000 | 4.94 | -12.23 | -21.049999 | -28.900000 | -42.540001 | -71.650002 | -77.550003 |
5563 rows × 32 columns
# ax= (
#     df
#     .reindex(sorted(df.columns), axis=1)
#     .filter(regex=("CIP_*"))
#     .loc["2024-07":,:]
#     .dropna()
#     .plot()
# )

# plt.ylim([-100,100])
# box = ax.get_position()
# ax.set_position([box.x0, box.y0, box.width * 0.8, box.height])

# # Put a legend to the right of the current axis
# ax.legend(loc='center left', bbox_to_anchor=(1, 0.5))

# plt.ylabel(f"Spread (bps)")
# plt.title("CIP Arbitrage Spread");
